Image Details
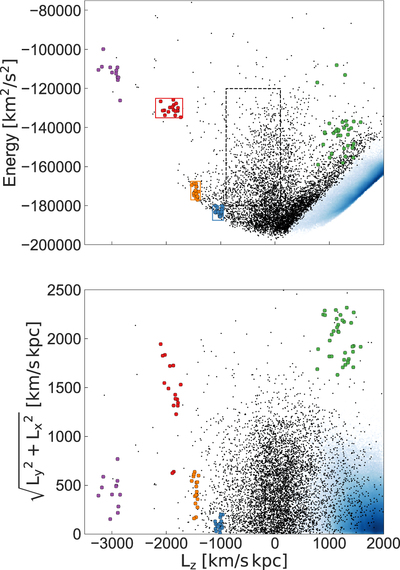
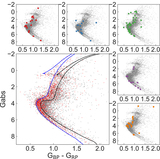
Caption: Figure 4.
Distribution of stars in energy E vs. Lz (top), and in L⊥ vs. Lz (bottom), highlighting the location of the various tight structures also seen in Figure 2. The blue density maps mark the contribution of all the stars in the Gaia DR2 6D sample located within 1 kpc from the Sun.
Other Images in This Article
Copyright and Terms & Conditions
© 2018. The American Astronomical Society. All rights reserved.
Copyright ©
2024 Astronomy Image Explorer. All Rights Reserved.