Image Details
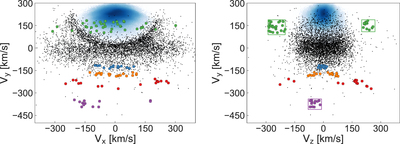
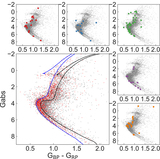
Caption: Figure 2.
Velocity distribution of halo stars (black dots and colored circles) selected according to the Toomre diagram shown in Figure 1. The blue density maps show the velocity distributions of all stars within 1 kpc from the Sun and reveal the contribution of the disk(s). The left panel illustrates particularly clearly the effect of our kinematic selection criterion. The colored stars mark the location of tight clumps that are easy to discern because of their large velocities.
Other Images in This Article
Copyright and Terms & Conditions
© 2018. The American Astronomical Society. All rights reserved.
Copyright ©
2026 Astronomy Image Explorer. All Rights Reserved.