Image Details
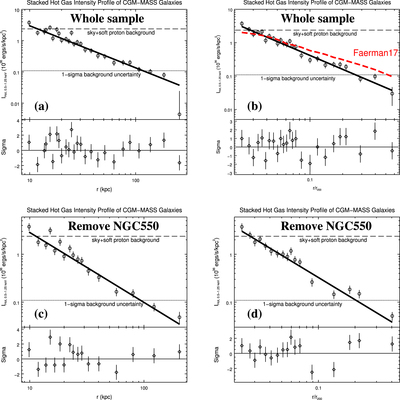
Caption: Figure 1.
Stacked radial intensity profiles of the hot gas component of the CGM-MASS galaxies. Different panels have the galactocentric radial distance of different galaxies rescaled to kpc (a), (c) and r200 (b), (d). The solid line is the best-fit β-function. The dashed and dotted lines show the sky+soft proton background and the 1σ uncertainty. Errors are statistical only. In panel (b), the red dashed curve is the Faerman et al. (2017) model scaled with r200 of a MW-sized halo and renormalized to fit the data at r < 0.08r200 ≈ 20 kpc. Such a model has significantly flatter X-ray intensity profile at large radii than what is measured for the more massive CGM-MASS galaxies, but such a difference is not visible at r ≲ 0.1r200. In panels (c) and (d), NGC 550 has been removed from the stacking because there is an X-ray luminous background cluster Abell 189 projected close to this galaxy (Li et al. 2017). The data used to create this figure are available.
Other Images in This Article
Copyright and Terms & Conditions
© 2018. The American Astronomical Society. All rights reserved.