Image Details

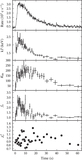
Caption: Figure 5.
Bolometric unabsorbed flux from time-resolved spectroscopy, where the shaded bands indicate the 1σ error regions. Top: fit with scaled pre-burst component shows this part to increase during the burst (dotted line indicates the pre-burst flux level). Bottom: alternative fit with reflection model. The vertical dotted line demarcates the two fitted intervals of the peak and tail.
Other Images in This Article
Copyright and Terms & Conditions
© 2018. The American Astronomical Society. All rights reserved.
Copyright ©
2025 Astronomy Image Explorer. All Rights Reserved.