Image Details
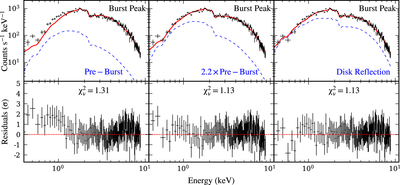
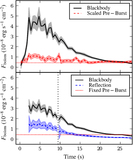
Caption: Figure 3.
Spectral fits to burst peak (top panels; solid line is the best-fit model and dashed line illustrates one model component) and the fit residuals with the goodness of fit, ﹩{\chi }_{\nu }^{2}﹩ (bottom panels). Left: the commonly used spectral model with a blackbody and fixed pre-burst spectrum leaves a substantial soft excess. Middle: an increase in the normalization of the pre-burst component fits the excess. Right: alternatively, a disk reflection component produces a similar improvement.
Other Images in This Article
Copyright and Terms & Conditions
© 2018. The American Astronomical Society. All rights reserved.
Copyright ©
2025 Astronomy Image Explorer. All Rights Reserved.