Image Details
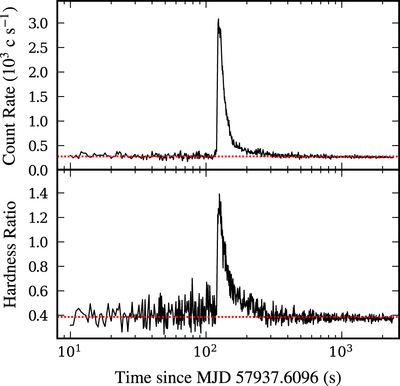
Caption: Figure 1.
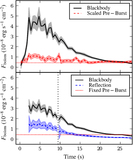
(Top) Light curve of the NICER pointing with the burst on 2017 July 3. Initially, the plotted resolution is 0.5 s, and 500 logarithmically spaced bins are employed after 150 s. (Bottom) Hardness ratio of count rate with E > 2.5 keV to E < 2.5 keV. The dotted lines indicate mean values over the first 100 s.
Other Images in This Article
Copyright and Terms & Conditions
© 2018. The American Astronomical Society. All rights reserved.
Copyright ©
2025 Astronomy Image Explorer. All Rights Reserved.