Image Details
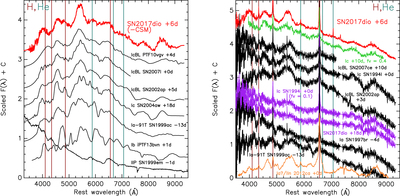
Caption: Figure 3.
(Left) Comparison of the CSM interaction-subtracted spectrum of SN 2017dio (red) with spectra of other SNe (black; including SNID templates of Modjaz et al. 2014). (Right) Comparison of the +6 day spectrum of SN 2017dio (red) with those of other SNe combined with interaction spectrum (black; fV = 0.3), a template SN Ic+CSM interaction spectrum from Leloudas et al. (2015, green), and SN 2012ca (orange). The spectrum of SN 1994I combined with the interaction spectrum (fV = 0.1) is showed for comparison with SN 2017dio at +18 days. The comparison spectra are from WISeREP. In both panels, phases are days from maximum for spectra other than SN 2017dio.
Other Images in This Article
Copyright and Terms & Conditions
© 2018. The American Astronomical Society. All rights reserved.