Image Details
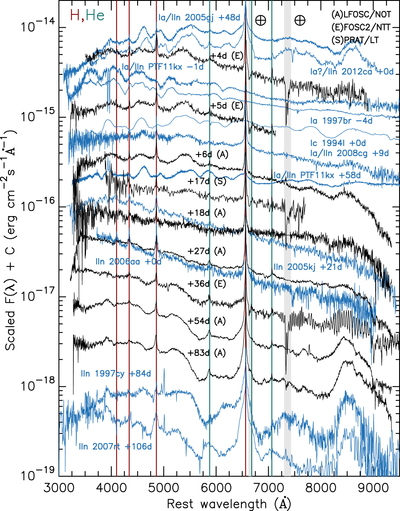
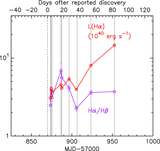
Caption: Figure 1.
Spectral sequence of SN 2017dio. Comparison spectra of other SNe (obtained through WISeREP—https://wiserep.weizmann.ac.il/—Yaron & Gal-Yam 2012) are plotted in blue. Phases for SN 2017dio are days after the discovery, while for other SNe phases are post maximum. The rest wavelengths of the H I lines are indicated with dark red and He I with dark green lines. Telluric absorption regions in SN 2017dio spectra are indicated with gray shading. SN 2017dio spectra will be made publicly available at WISeREP and the Open Supernova Catalog (https://sne.space/; Guillochon et al. 2017).
Other Images in This Article
Copyright and Terms & Conditions
© 2018. The American Astronomical Society. All rights reserved.
Copyright ©
2025 Astronomy Image Explorer. All Rights Reserved.