Image Details
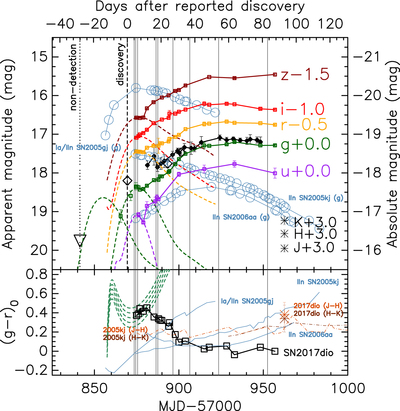
Caption: Figure 2.
(Top) Light curves of SN 2017dio in ugriz bands, and JHK photometric points. CRTS data points are plotted as g-band but not connected to the g-band LC. The absolute magnitudes assume only the distance modulus of 36.0 mag. ATLAS cyan band (open black diamonds) and orange band (filled black diamonds) data points are plotted. A non-detection (3σ) limiting magnitude is plotted with an upside-down triangle. Vertical gray lines indicate the epochs of spectroscopy. Dashed curves represent template SNe Ic LCs of Taddia et al. (2015). Another solution for the g-band LC peaking before the discovery is also plotted. The LCs of SNe 2005gj (Aldering et al. 2006; Holtzman et al. 2008), 2005kj and 2006aa (Taddia et al. 2013) in g-band absolute magnitude are shown in blue, with their phases shifted to have the peak (SN 2005gj) or discovery epoch (SNe 2005kj, 2006aa) matching the SN Ic LC peak. (Bottom) Color curves of SNe 2017dio, 2005gj, 2005kj, and 2006aa, in ﹩{(g-r)}_{0}﹩ (corrected for foreground extinction). The green dashed area represents typical SNe Ic (Taddia et al. 2015). ﹩(J-H)﹩ and ﹩(H-K)﹩ colors are plotted in comparison to SN 2005kj.
Other Images in This Article
Copyright and Terms & Conditions
© 2018. The American Astronomical Society. All rights reserved.