Image Details
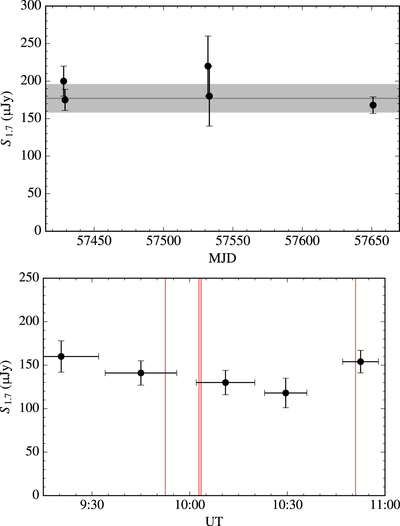
Caption: Figure 5.
Top: light curve of the persistent source at 1.7 GHz during all the EVN epochs. The horizontal line represents the average flux density value and its 1σ standard deviation. Bottom: light curve of the source within the 2016 September 20 epoch (last epoch in the top figure). The vertical red lines represent the arrival times of the four detected bursts. We do not detect brightening of the persistent source on these timescales after the bursts.
Other Images in This Article
Copyright and Terms & Conditions
© 2017. The American Astronomical Society. All rights reserved.
Copyright ©
2024 Astronomy Image Explorer. All Rights Reserved.