Image Details
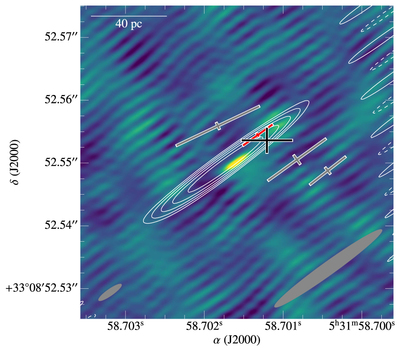
Caption: Figure 1.
EVN image of the persistent source at 1.7 GHz (white contours) together with the localization of the strongest burst (red cross), the other three observed bursts (gray crosses), and the position obtained after averaging all four bursts detected on 2016 September 20 (black cross). Contours start at a 2σ noise level of 10 μJy and increase by factors of ﹩{2}^{1/2}﹩. Dashed contours represent negative levels. The color scale shows the image at 5.0 GHz from 2016 September 21. The synthesized beam at 5.0 GHz is represented by the gray ellipse at the bottom left of the figure and for 1.7 GHz at the bottom right. The lengths of the crosses represent the 1σ uncertainty in each direction. Crosses for each individual burst reflect only the statistical errors derived from their S/N and the beam size. The size of the cross for the mean position is determined from the spread of the individual burst locations, weighted by ξ (see the text), and is consistent with the centroid of the persistent source to within ﹩\lt 2\sigma ﹩.
Other Images in This Article
Copyright and Terms & Conditions
© 2017. The American Astronomical Society. All rights reserved.