Image Details
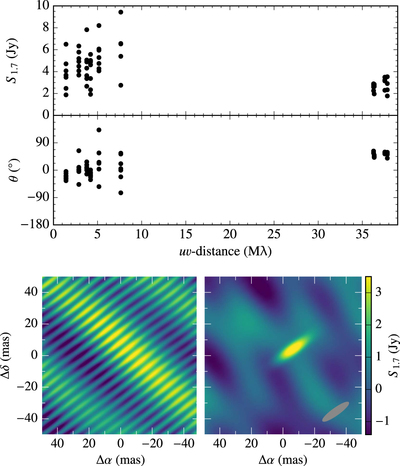
Caption: Figure 3.
Top: amplitudes and phases of the obtained visibilities for the strongest burst observed on 2016 September 20 (burst #2 in Table 1) as a function of the uv-distance. Bottom: dirty (left) and cleaned (right) image for the same burst. The cleaned image has been obtained by fitting the uv-data with a circular Gaussian component. The synthesized beam is shown by the gray ellipse at the bottom right of the figure. The coordinates are relative to the position of the persistent source obtained in the same epoch.
Other Images in This Article
Copyright and Terms & Conditions
© 2017. The American Astronomical Society. All rights reserved.
Copyright ©
2024 Astronomy Image Explorer. All Rights Reserved.