Image Details
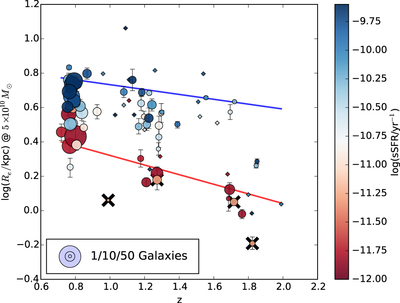
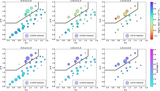
Caption: Figure 4.
Re at 5 × 10¹⁰ M⊙ vs. redshift. The samples belonging to each SED type are split into three redshift bins, the symbol size represents the number of galaxies in each datapoint, and the color coding reflects the average sSFR. Post-starburst SED types are indicated by the black crosses. We do not show vertical error bars for datapoints that contain only one galaxy. The lines are the best-fit relations for quiescent (sSFR ﹩\;\lt \;{10}^{-11}\;{\mathrm{yr}}^{-1}﹩) and star-forming (sSFR ﹩\;\gt \;{10}^{-11}\;{\mathrm{yr}}^{-1}﹩) galaxies by van der Wel et al. (2014) for the same stellar mass. At all redshifts, star-forming galaxies are larger than quiescent galaxies, and both populations increase in size over cosmic time.
Other Images in This Article
Copyright and Terms & Conditions
© 2016. The American Astronomical Society. All rights reserved.