Image Details
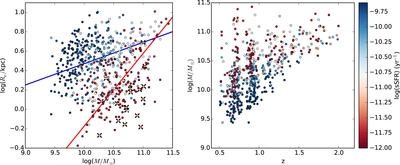
Caption: Figure 1.
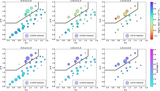
Effective radius vs. stellar mass (left) and stellar mass vs. redshift (right) color coded by sSFR for the individual galaxies included in the composite SEDs. In the left panel we show the best-fit relations for star-forming (blue line; sSFR > 10−11 yr−1) and quiescent (red line; sSFR < 10−11yr−1) galaxies found by adopting the power-law index by van der Wel et al. (2014) of ﹩{R}_{{\rm{e}}}\propto {M}^{0.22}﹩ and ﹩{R}_{{\rm{e}}}\propto {M}^{0.75}﹩, respectively. In the left panel post-starburst galaxies are indicated by black crosses.
Other Images in This Article
Copyright and Terms & Conditions
© 2016. The American Astronomical Society. All rights reserved.
Copyright ©
2025 Astronomy Image Explorer. All Rights Reserved.