Image Details
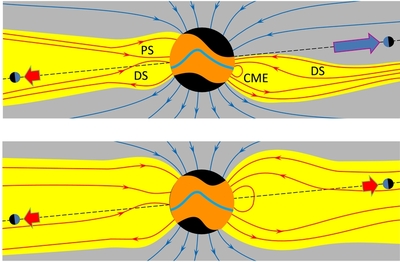
Caption: Figure 3.
Schematics of the solar atmosphere and interplanetary space at sunspot minimum, viewed in a reference frame co-rotating with the solar corona with two snapshots of the Earth's location, half a solar rotation period apart. The black areas in the solar atmosphere are the unipolar polar coronal holes from which open magnetic flux (blue lines) and the lower-temperature, fast solar wind emerges. The yellow area is the streamer belt where hotter, slow solar wind emerges from both dipolar streamers (DS) or pseudostreamers (PS), in which field lines, shown in red, of opposite and same polarity meet, respectively. The light blue line is the base of the heliospheric current sheet. The dashed line is the ecliptic plane. The top panel is typical of recent solar minima, the left half shows slow solar wind (red arrow) impinging on the Earth and the right shows the situation half a rotation later when Earth is in the fast solar wind (blue arrow). (Also note that a coronal mass ejection (CME) is shown emerging along the streamer belt). The bottom panel shows a grand solar minimum with a lower open solar flux but continued base-level CME emergence giving a broader streamer belt.
Other Images in This Article
Copyright and Terms & Conditions
© 2014. The American Astronomical Society. All rights reserved.