Image Details
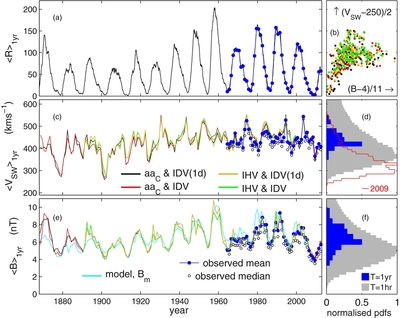
Caption: Figure 2.
(a): 12-point running means of monthly international sunspot numbers,
![]() R
R
![]() 1yr. (c) and (e): Reconstructed annual near-Earth SW speed
1yr. (c) and (e): Reconstructed annual near-Earth SW speed
![]() V
SW
V
SW
![]() 1yr (panel (c)) and IMF
1yr (panel (c)) and IMF
![]() B
B
![]() 1yr (panel (e)) from the various pairings of geomagnetic indices. The blue filled and black open dots give annual mean and median
values, respectively, of satellite observations and the cyan line in panel (e) is the modeled field
B
m shown in Figure
1. (d) and (f): normalized distributions of hourly (in gray) and annual (in blue) means of
V
SW (panel (d)) and B (panel (f)), observed during the space age (note that the pdf scale has been halved for annual values for
clarity). Panel (d) also shows the distribution of hourly
V
SW means for the calendar year 2009. (b):
1yr (panel (e)) from the various pairings of geomagnetic indices. The blue filled and black open dots give annual mean and median
values, respectively, of satellite observations and the cyan line in panel (e) is the modeled field
B
m shown in Figure
1. (d) and (f): normalized distributions of hourly (in gray) and annual (in blue) means of
V
SW (panel (d)) and B (panel (f)), observed during the space age (note that the pdf scale has been halved for annual values for
clarity). Panel (d) also shows the distribution of hourly
V
SW means for the calendar year 2009. (b):
![]() V
SW
V
SW
![]() 1yr as a function of
1yr as a function of
![]() B
B
![]() 1yr. In panels (b), (c), and (e), black, red, orange, and green are for reconstructed values from the pairings of, respectively,
IDV(1d) −
aa
C,
IDV −
aa
C,
IDV(1d) −
IHV, and
IDV −
IHV.
1yr. In panels (b), (c), and (e), black, red, orange, and green are for reconstructed values from the pairings of, respectively,
IDV(1d) −
aa
C,
IDV −
aa
C,
IDV(1d) −
IHV, and
IDV −
IHV.
Other Images in This Article
Copyright and Terms & Conditions
© 2014. The American Astronomical Society. All rights reserved.