Image Details
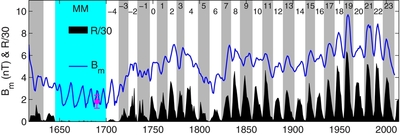
Caption: Figure 1.
Variation of sunspot numbers, R (black shaded area), and modeled near-Earth IMF, B m (blue line). Even- and odd-numbered solar cycles are shaded white and gray and the Maunder minimum (MM) is in cyan. R is the international sunspot number extended back to before the MM using a linear regression of the group sunspot number ( R/30 is shown to allow use of a common vertical scale). B m is derived from the OSF modeled from R using the continuity equation (Owens & Lockwood 2012), which is subsequently converted into near-Earth IMF using an empirical relationship (Lockwood et al. 2009; Lockwood 2013). The mauve point and error bar is the estimate of IMF for the end of the MM from cosmogenic isotopes (Steinhilber et al. 2010).
Other Images in This Article
Copyright and Terms & Conditions
© 2014. The American Astronomical Society. All rights reserved.