Image Details
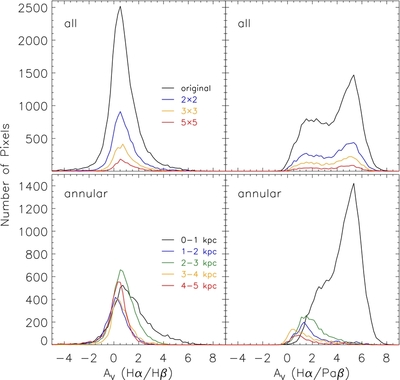
Caption: Figure 3.
Histograms of the visual extinction A V in the whole FoV (top) and a series of annuli (bottom), derived from the Hα/Hβ and Hα/Paβ line ratios. The difference in the number of the involved pixels is a result of their respective 5σ cutoffs and FoVs. The histograms as a result of rebinning the maps onto a coarser grid are over-plotted in the top panels.
Other Images in This Article
Copyright and Terms & Conditions
© 2013. The American Astronomical Society. All rights reserved.
Copyright ©
2025 Astronomy Image Explorer. All Rights Reserved.