Image Details
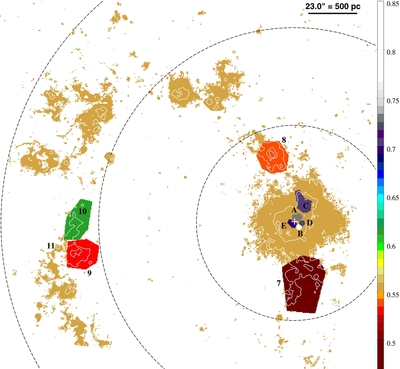
Caption: Figure 1.
[N ii]/Hα ratio map for M83 adopted in this work, overlaid on the Hα+[N ii] contour map. The letters and numbers denote the regions studied by Bresolin & Kennicutt (2002). Only the southern pointing is shown because none of the H ii regions in the northern pointing has been observed by those authors. The color bar to the right indicates the ratio of the total intensity of the nitrogen doublet (λλ6548, 6584 Å) to the Hα line intensity. The kinematic nucleus is marked with a white plus sign following Knapen et al. (2010), and the black dashed circles depict the galactic radii of 1, 2 and 3 kpc that are used for the calculations in Table 1 and Figure 3.
Other Images in This Article
Copyright and Terms & Conditions
© 2013. The American Astronomical Society. All rights reserved.