Image Details

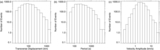
Caption: Figure 5.
Panel (a) displays the displacement amplitude ( A 0) against initial period ( P 0), (b) displays the velocity amplitude ( V) against initial period, (c) is velocity power against initial period. The solid line in panels (a) and (b) shows the power-law fitted to the data. The solid line and dashed line in panel (c) show the velocity power spectrum for horizontal photospheric motions from Figure 3 in Matsumoto & Kitai (2010) and the solid line from Figure 9 of Chitta et al. (2012). The photospheric power spectra have been scaled for comparison with the prominence transverse wave power spectrum. In all panels, the triple-dot-dash line shows the observational limits.
Other Images in This Article
Copyright and Terms & Conditions
© 2013. The American Astronomical Society. All rights reserved.