Image Details
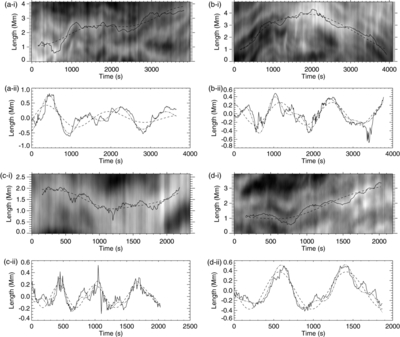
Caption: Figure 3.
Panels (a-i) to (d-i) display four examples of threads with their centers traced by black lines (dashed lines show the trend of each thread found through application of EMD). The panels (a-ii) to (d-ii) show plots of the detrended curve (solid line), the fit to the initial curve (dashed line) and a combination of the original fit and the residual fit (dot-dash line).
Other Images in This Article
Copyright and Terms & Conditions
© 2013. The American Astronomical Society. All rights reserved.
Copyright ©
2025 Astronomy Image Explorer. All Rights Reserved.