Image Details
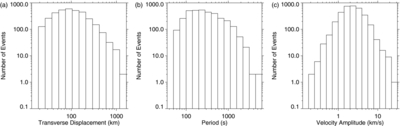
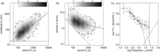
Caption: Figure 4.
Histograms showing the frequency as a function of displacement amplitude ( A 0), period ( P 0) and velocity amplitude ( V). All histograms are plotted with a log-log scale to allow the ranges to be clearly observable. Only oscillations that display ⩾1.5 periods are included in the analysis.
Other Images in This Article
Copyright and Terms & Conditions
© 2013. The American Astronomical Society. All rights reserved.
Copyright ©
2025 Astronomy Image Explorer. All Rights Reserved.