Image Details
Caption: Figure 4.
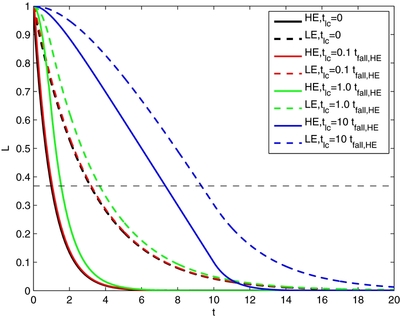
Exponentially decaying light curves of a flare in the MT. High- and low-energy luminosities (
![]() HE/
HE/
![]() LE = 10) are plotted (normalized to 1) for increasing
t
lc. Solid lines represent
LE = 10) are plotted (normalized to 1) for increasing
t
lc. Solid lines represent
![]() HE and dashed lines
HE and dashed lines
![]() LE. Colors represent
t
lc at differing factors of
t
f
, where
t
f, HE
is normalized to 1. The dashed black line is the 1/
e decay time.
LE. Colors represent
t
lc at differing factors of
t
f
, where
t
f, HE
is normalized to 1. The dashed black line is the 1/
e decay time.
Other Images in This Article

Copyright and Terms & Conditions
© 2012. The American Astronomical Society. All rights reserved.
Copyright ©
2025 Astronomy Image Explorer. All Rights Reserved.