Image Details
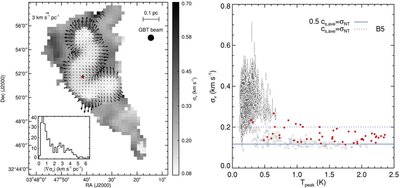
Caption: Figure 4.
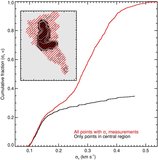
Left panel: velocity dispersion map in the background. The young star, B5–IRS1, is shown by the star. The velocity dispersion
gradient is shown by the arrows. The inset shows the velocity dispersion gradient distribution. The narrow peak at low values
are the positions within the coherent core, while the transition surface populates the second distribution of points at larger
values. Right panel: velocity dispersion as a function of peak antenna temperature (
T
peak). Red points are positions with a distance to B5–IRS1 smaller than 2.025 times the GBT beam. The peak antenna temperature
can be used as a proxy of distance from the center, where high
T
peak are found close to the center of the core and low
T
peak are found at larger distances. Note the small dispersion in σ
v
at high
T
peak (the coherent core) consistent with subsonic non-thermal components, and the abrupt increase in σ
v
when approaching the transition to coherence with supersonic non-thermal components. The dispersion in σ
v
within the coherent core is even smaller after considering that the red points are affected by the central YSO. Blue horizontal
lines show the expected velocity dispersion for two values of the velocity dispersion non-thermal component (
 ): 0.5
c
s,ave
, and
c
s,ave
, where
c
s,ave
is the sound speed of the average particle (μ = 2.33) assuming
T
kin=10 K.
): 0.5
c
s,ave
, and
c
s,ave
, where
c
s,ave
is the sound speed of the average particle (μ = 2.33) assuming
T
kin=10 K.
Other Images in This Article
Copyright and Terms & Conditions
© 2010. The American Astronomical Society. All rights reserved.