Image Details
Caption: Figure 1.
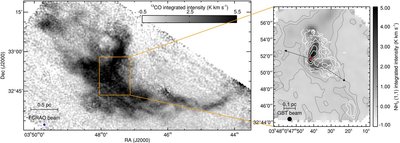
Left panel: map of 13CO(1–0) integrated intensity for the B5 region obtained by the COMPLETE Survey (Ridge et al. 2006). The orange box shows the area mapped with the GBT. Right panel: integrated intensity map of B5 in NH 3(1,1). White contours are BOLOCAM dust continuum emission (Enoch et al. 2006), while gray contours show the 0.15 and 0.3 K km s -1 levels in NH 3(1,1) integrated intensity. The young star, B5–IRS1, is shown by the star. The outflow direction is shown by the arrows.
Other Images in This Article
Copyright and Terms & Conditions
© 2010. The American Astronomical Society. All rights reserved.
Copyright ©
2024 Astronomy Image Explorer. All Rights Reserved.