Image Details
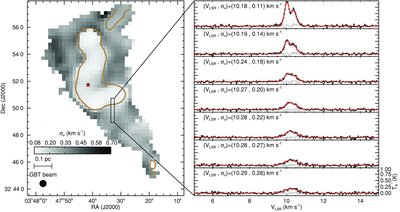
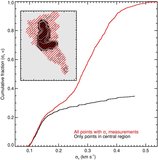
Caption: Figure 3.
Velocity dispersion map derived from fitting all hyperfine components simultaneously. The protostar position is shown by the star, and the contour shows the contour T peak = 0.5 K. The box on the map presents the region where we zoom in and present the corresponding spectra in the right panel, which shows only the main component of the NH 3(1,1) line. The centroid velocity and velocity dispersion obtained from the fit are displayed for each position. Top spectra in the right panel display two main hyperfine components clearly separated thanks to their low-velocity dispersion (the coherent core), while when moving to positions outside the core the lines get weaker and broader (evident by the disappearance of the gap between hyperfine components).
Other Images in This Article
Copyright and Terms & Conditions
© 2010. The American Astronomical Society. All rights reserved.