Image Details
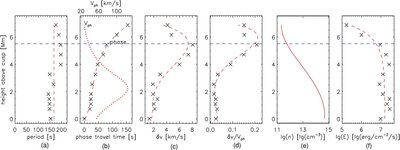
Caption: Figure 4.
Height variation of parameters for the kink wave. The symbol "×" in the panels represents the parameter values at various heights, which are obtained by fitting the oscillation profiles with a sine function. (a) The periods for transverse oscillation at various heights are plotted as "×"s. The averaged period is marked with a red vertical line. (b) The phase travel times are plotted as "×"s, which are fitted with a polynomial function and plotted as a red dashed line. The phase speed profile is plotted as a red dotted line. (c) The velocity amplitudes are plotted as "×"s, and the polynomial-fitting result is given by the red dashed line. (d) The height variation of relative disturbance is plotted as a red dashed line. (e) The assumed number density profile, which has appropriate values both for the low chromosphere and the transition region, is plotted as a red solid line. (f) The profile of energy flux density carried by the kink wave, which is scaled to h = 5.5 Mm, is plotted as "×"s. The fitting result is shown as a red dashed line.
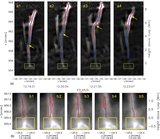
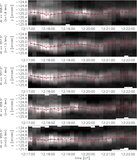
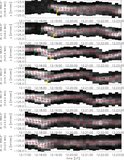
Other Images in This Article
Copyright and Terms & Conditions
© 2009. The American Astronomical Society. All rights reserved.