Image Details
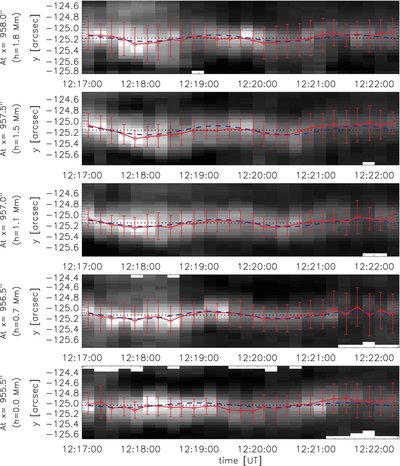
Caption: Figure 2.
Diagrams of the transverse displacement vs. time for the Ca ii intensity across the spicule at the lower section of spicule trace. The transverse displacement profile at each height is plotted as a red line with a strand of red diamonds. The half length of each vertical bar represents a σ width, which is defined in the text. The blue dashed line in each panel is the sine-fitting result for the transverse displacement profile. The black-dotted line is placed at the average position.
Other Images in This Article
Copyright and Terms & Conditions
© 2009. The American Astronomical Society. All rights reserved.
Copyright ©
2025 Astronomy Image Explorer. All Rights Reserved.