Image Details
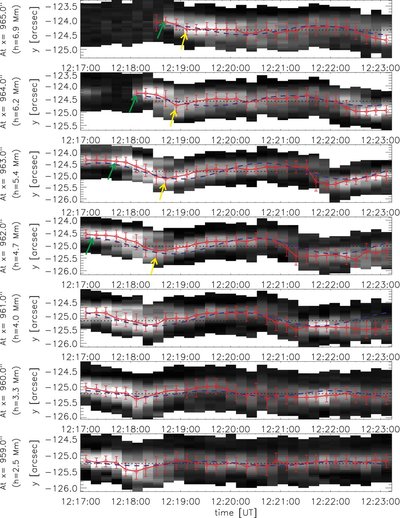
Caption: Figure 3.
Transverse-displacement–time diagrams of the Ca ii intensity across the spicule at the higher section of spicule trace. The transverse-displacement profile at each height is plotted as a red line with a strand of red diamonds. Vertical bars are used to mark the σ width on two sides. The sine-fitting results are shown as blue dashed lines. The average position is marked with a black dotted line. The yellow arrows represent the propagation of the transverse-displacement oscillation, and the green arrows denote the motion of the jet head.
Other Images in This Article
Copyright and Terms & Conditions
© 2009. The American Astronomical Society. All rights reserved.
Copyright ©
2025 Astronomy Image Explorer. All Rights Reserved.