Image Details
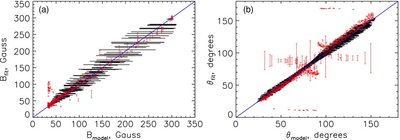
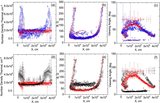
Caption: Figure 5.
Correlation plots of the recovered vs. model values for the magnetic field (a) and the viewing angle (b) for single power-law distribution of fast electrons over the kinetic energy. The red vertical bars represent the fitting ±1σ intervals around the recovered values, while the black horizontal bars represent the ±1σ intervals around the corresponding model parameters averaged along the line of sight associated with a given image pixel. Just for convenience, an ideal perfect correlation is indicated in each panel by a blue line. In panel (b), unlike in Figure 2(c), the ambiguity of the viewing angle recovery has been removed by using the "observational" data on the sense of polarization.
Other Images in This Article
Copyright and Terms & Conditions
© 2009. The American Astronomical Society. All rights reserved.