Image Details
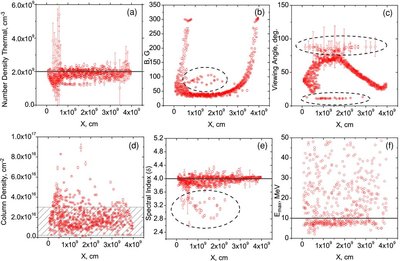
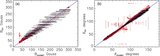
Caption: Figure 2.
Fitting results for the electron distribution with power law over the kinetic energy. The horizontal gray lines in panels (a), (e), and (f) show the model parameters actually used for the thermal plasma density, electron spectral index δ, and the maximum electron energy E max, respectively. The striped region in panel (d) indicates the range of the electron column density in the model. The fit to model comparison for the magnetic field and the viewing angle is presented in Figure 5. Note that due to an ambiguity of the viewing angle recovery discussed in the text the recovered values of the viewing angle are upper bounded by 90°.
Other Images in This Article
Copyright and Terms & Conditions
© 2009. The American Astronomical Society. All rights reserved.