Image Details
Caption: Figure 3.
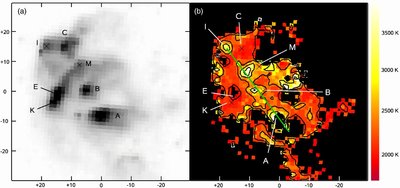
(a) IRAC 4.5 μm image of HH 54. Image center is at α(J2000) = 12
h55
m49
![]() 5 δ(J2000) = −76°56′22''. Individual knots are identified and labeled according to Giannini et al. (2006). Knot I, not seen
on the NIR, is identified as the optical counterpart to HH 54I. (b) Temperature map of HH 54 based on IRAC color–color analysis
for 2000 K ⩽
T⩽ 4000 K. The black contour levels are 2000 K, 2500 K, 3000 K, and 3500 K. The green line connecting the higher temperature
knots A, B, and I points toward the proposed source IRAS 12496–7650.
5 δ(J2000) = −76°56′22''. Individual knots are identified and labeled according to Giannini et al. (2006). Knot I, not seen
on the NIR, is identified as the optical counterpart to HH 54I. (b) Temperature map of HH 54 based on IRAC color–color analysis
for 2000 K ⩽
T⩽ 4000 K. The black contour levels are 2000 K, 2500 K, 3000 K, and 3500 K. The green line connecting the higher temperature
knots A, B, and I points toward the proposed source IRAS 12496–7650.
Other Images in This Article
Copyright and Terms & Conditions
© 2009. The American Astronomical Society. All rights reserved.
Copyright ©
2025 Astronomy Image Explorer. All Rights Reserved.