Image Details
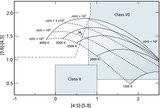
Caption: Figure 2.
IRAC color–color plot for identified knots in HH 54. Each point represents the colors at an individual pixel within the knots. Different knots are represented with different symbols.
Other Images in This Article
Copyright and Terms & Conditions
© 2009. The American Astronomical Society. All rights reserved.
Copyright ©
2025 Astronomy Image Explorer. All Rights Reserved.