Image Details
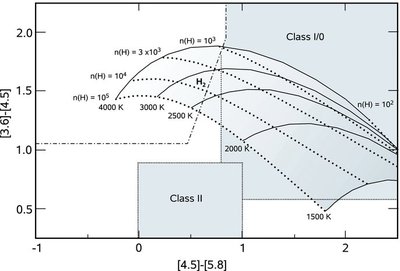
Caption: Figure 1.
IRAC [3.6] − [4.5] vs. [4.5] − [5.8] color–color plot indicating the region occupied by shocked H 2. Constant density (dotted) and temperature (solid) lines are indicated. The region to the left and above the dashed–dotted line was empirically determined by Gutermuth et al. (2008) to contain outflows.
Other Images in This Article
Copyright and Terms & Conditions
© 2009. The American Astronomical Society. All rights reserved.
Copyright ©
2025 Astronomy Image Explorer. All Rights Reserved.