Image Details
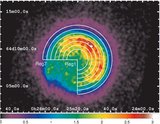
Caption: Figure 4.
Spectra and spectral ratios for bands containing the Si, S, and Fe Kα lines. Top: spectra in regions 1 (open circles) and 7 (open squares). Spectra in region 7 were multiplied by 0.6. Bottom: ratios of spectra in region 1 to those in region 7.
Other Images in This Article
Copyright and Terms & Conditions
© 2009. The American Astronomical Society. All rights reserved.
Copyright ©
2025 Astronomy Image Explorer. All Rights Reserved.