Image Details
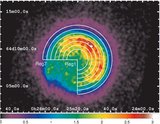
Caption: Figure 2.
Radial dependence of best-fit line energies (a) and widths (b). Data points were obtained from spectra extracted from the sum of the NE, NW, and SW segments indicated in Figure 1. Solid and dashed gray lines represent the roughly estimated profiles of the expanding shell model and the two-zone model, respectively.
Other Images in This Article
Copyright and Terms & Conditions
© 2009. The American Astronomical Society. All rights reserved.
Copyright ©
2025 Astronomy Image Explorer. All Rights Reserved.