Image Details
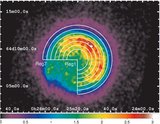
Caption: Figure 3.
Fitted Gaussian center energies and widths as a function of ionization timescale obtained from simulated nonequilibrium ionization plasma spectra with NEI model (version 1.1) at the electron temperatures of 0.6 (solid), 1.0 (dashed), 2.0 (dashed–dotted), 3.0 (dotted), and 4.0 keV (dashed–dotted–dotted–dotted). Horizontal lines in the upper panel show the range of observed center energies. The line in the bottom panel shows the measured FWHM of Region 5 for reference.
Other Images in This Article
Copyright and Terms & Conditions
© 2009. The American Astronomical Society. All rights reserved.
Copyright ©
2025 Astronomy Image Explorer. All Rights Reserved.