Image Details
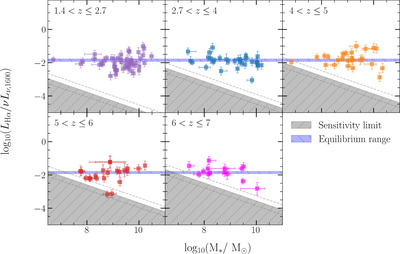
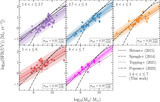
Caption: Figure 7.
The Hα-to-UV luminosity ratio vs. stellar mass for our galaxy sample. The gray hatched region shows the parameter space that we are not sensitive to assuming a limiting survey flux and a UV luminosity to stellar mass ratio (which we derive from the parameters reported in Table 1). We take the limiting flux in our sample to be 2.0 × 10⁻¹⁹ erg s−1 cm−2 since this is the lowest Hα flux we observe at a significance greater than 5σ. The dashed gray lines denote the uncertainty on the region of our sensitivity limits due to the intrinsic scatter in SFR(UV) vs. stellar mass relation. The horizontal blue hatched region shows the equilibrium range of Hα-to-UV luminosity calculated by V. Mehta et al. (2023).
Other Images in This Article

Copyright and Terms & Conditions
© 2024. The Author(s). Published by the American Astronomical Society.