Image Details

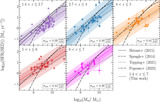
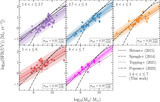
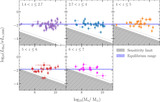
Caption: Figure 2.
Hα-based SFRs vs. stellar masses for the combined JADES and CEERS sample binned by redshift. The darker and lighter shaded regions denote the 1σ int and 2σ int intrinsic scatter intervals about the SFMS, respectively. The thick gray line shows the best-fit SFMS for the whole sample in the range 1.4 < z ≤ 7. The literature curves from I. Shivaei et al. (2015), P. Popesso et al. (2023), M. W. Topping et al. (2021), and J. S. Speagle et al. (2014) were shifted down in SFR by 0.32, 0.32, 0.37, and 0.32 dex, respectively, to match our low-metallicity Hα to SFR conversion. The slightly different shift for M. W. Topping et al. (2021) reflects the use of the C.-N. Hao et al. (2011) conversion, whereas the other works adopt the conversion from R. C. J. Kennicutt (1998).
Other Images in This Article

Copyright and Terms & Conditions
© 2024. The Author(s). Published by the American Astronomical Society.