Image Details
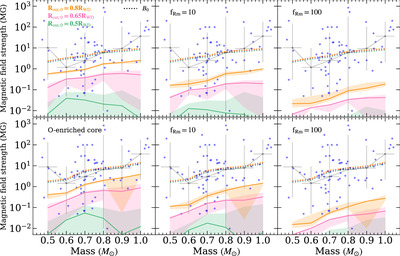
Caption: Figure 6.
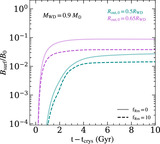
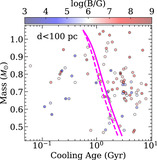
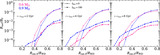
Predicted surface magnetic field strength (solid lines and filled regions) from our transport models as a function of the WD mass for different assumptions of the initial size of the convection zone R out,0 and turbulent magnetic diffusivity factor f Rm. We compare these models with observed fields in MWDs that are expected to be crystallizing in our sample shown in Figure 5 for both assumptions of the onset of crystallization; the top panels show the crystallizing MWDs obtained using the fiducial models from E. B. Bauer (2023), while the bottom panels are those obtained using the oxygen-enriched core models of D. Blatman & S. Ginzburg (2024). We binned by mass the observations (black points with error bars) to set the cooling age for our evolution models, then the solid lines represent the final surface field when reaching the average cooling age in each bin, and the filled regions are the fields obtained for the one-standard-deviation range of the cooling age (see text for details). The dashed lines represent the prediction for the initial magnetic field as discussed in Section 2.2.
Other Images in This Article
Copyright and Terms & Conditions
© 2024. The Author(s). Published by the American Astronomical Society.