Image Details
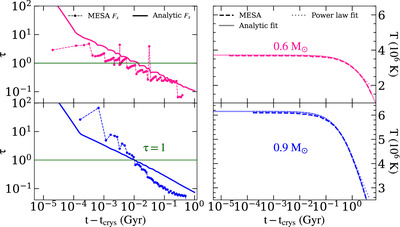
Caption: Figure 1.
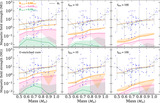
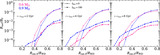
Left panels: normalized composition flux τ computed for the MESA cooling WD models of 0.6 (pink) and 0.9 M ⊙ (blue) using the estimation of F X directly from the MESA output of the mass ﹩{M}_{\mathrm{core}}﹩ and radius ﹩{R}_{\mathrm{core}}﹩ of the crystallized core (dashed lines with data points), and using the analytic fit shown in Equation (4) (solid lines). Right panels: cooling tracks for the core temperature of the MESA WD models (dashed lines) along with the analytic fit done from Equation (5) (solid lines, and dotted for only the power-law component) and used to compute the analytical fit for τ. The bumps in the analytic curves are due to interpolation of the stellar parameters used to compute τ.
Other Images in This Article
Copyright and Terms & Conditions
© 2024. The Author(s). Published by the American Astronomical Society.