Image Details
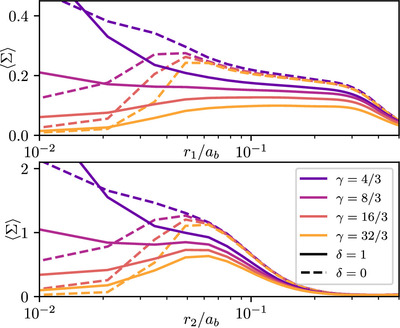
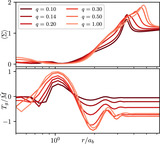
Caption: Figure 17.
Time- and azimuth-averaged surface density profiles in the frame of the primary (top panel) and secondary (bottom panel). Different line colors, from dark to light, indicate different sink rates from slow to fast. Solid line plot profiles derived from simulations using standard sinks, and dashed line plot profiles derived from simulations using torque-free sinks, which are the default for the simulations in this work. We observe that standard sinks significantly deplete the surface density profile well beyond the sink radius (0.035a b ), and the profiles do not converge at any value of the sink rate. Torque-free sinks, on the other hand, appear to produce converged surface density profiles throughout the bulk of the minidisks at γ ≥ 8/3.
Other Images in This Article
Show More
Copyright and Terms & Conditions
© 2024. The Author(s). Published by the American Astronomical Society.