Image Details
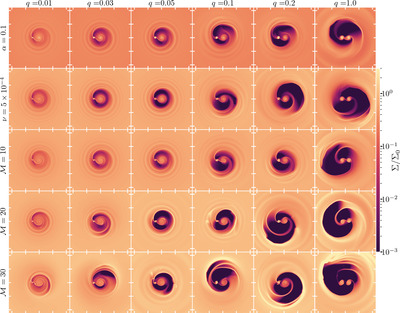
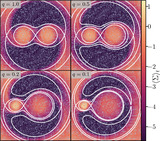
Caption: Figure 1.
Surface density profiles from a subset of our simulations, increasing in binary mass ratio from left to right. Profiles from simulations with q < 0.1 are presented at t = 2000π, and profiles from simulations with q ≥ 0.1 are presented at t = 4000π. Snapshots from simulations with q ≥ 0.1. Results from simulations of ﹩{ \mathcal M }=10﹩ disks with α = 0.1 and ﹩\nu =0.0005{a}_{b}^{2}{{\rm{\Omega }}}_{b}﹩ are presented in the first and second rows, respectively. The third, fourth, and fifth rows display results from simulations of ﹩\nu =0.001{a}_{b}^{2}{{\rm{\Omega }}}_{b}﹩ disks at ﹩{ \mathcal M }=\{10,20,30\}﹩, respectively. In all cases deeper and larger cavities form at higher mass ratios. At higher Mach numbers the cavity remains visibly eccentric even at very low mass ratios, although in thicker disks the cavity eccentricities driven by lower mass ratio binaries become more subtle. Tick markings are spaced 2a b apart.
Other Images in This Article
Show More
Copyright and Terms & Conditions
© 2024. The Author(s). Published by the American Astronomical Society.