Image Details
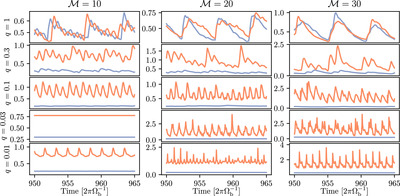
Caption: Figure 14.
Accretion rate time series, over 15 orbital periods, for a representative sample of binaries of mass ratios. In each panel, the accretion rate onto the primary is plotted in blue (﹩{\dot{M}}_{1}/{\dot{M}}_{0}﹩), and the accretion rate onto the secondary is plotted in orange (﹩{\dot{M}}_{2}/{\dot{M}}_{0}﹩), in both cases normalized by the equilibrium accretion rate for each simulation. At lower mass ratios (q ≲ 0.1), the accretion rate onto the primary is fairly constant, and well below the accretion rate onto the secondary. The nearly constant accretion rates in the ﹩{ \mathcal M }=10﹩, q = 0.03 simulation are due to the negligible circumbinary disk eccentricity that develops (e.g., Figure 6).
Other Images in This Article
Show More
Copyright and Terms & Conditions
© 2024. The Author(s). Published by the American Astronomical Society.