Image Details
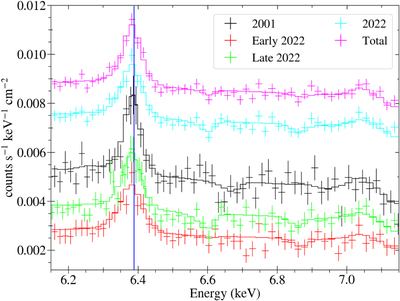
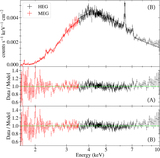
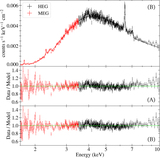
Caption: Figure 7.
Zoomed-in spectra of the 6.15–7.15 keV energy range, featuring the Fe Kα and Fe Kβ emission lines, the Fe XXV and Fe XXVI absorption lines, as well as the Fe edge. The best fits of model B to the spectra are also depicted as continuous lines through the data. The vertical blue line marks the expected centroid energy of the Fe Kα line, based on the Cen A systemic velocity. The spectra were rebinned for clarity of display. The 2022 and total spectra were shifted upwards in this figure to distinguish them from the other spectra.
Other Images in This Article
Copyright and Terms & Conditions
© 2024. The Author(s). Published by the American Astronomical Society.
Copyright ©
2025 Astronomy Image Explorer. All Rights Reserved.