Image Details
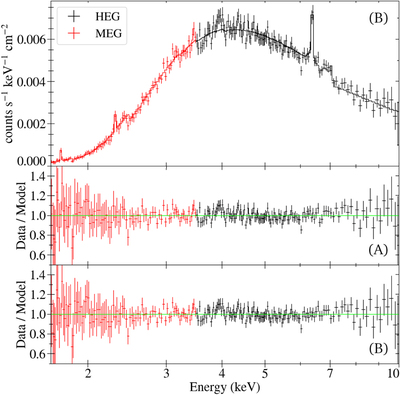
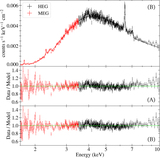
Caption: Figure 3.
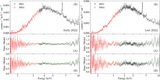
The best-fit spectra, and the ratio of the data to the folded model, for the grouped 2001 spectrum. The first panel shows the spectrum, and the best fit using model B. The subsequent two panels depict the residuals normalized by the folded model for spectral models A and B. The spectra were rebinned for visual clarity.
Other Images in This Article
Copyright and Terms & Conditions
© 2024. The Author(s). Published by the American Astronomical Society.
Copyright ©
2025 Astronomy Image Explorer. All Rights Reserved.