Image Details
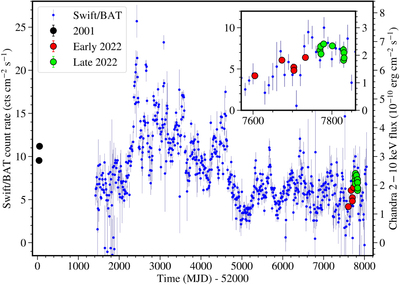
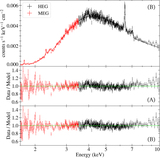
Caption: Figure 1.
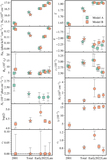
Swift/BAT light curve of Cen A with overplotted 2–10 keV Chandra fluxes for each of the observations listed in Table 1. The inset shows the observations obtained throughout 2022. The Swift/BAT daily light curve was rebinned by a factor of 10 for clarity of display. The colors of the Chandra data points indicate the three distinct groups into which the spectra were merged. The error bars for the Chandra fluxes are smaller than the size of the data points.
Other Images in This Article
Copyright and Terms & Conditions
© 2024. The Author(s). Published by the American Astronomical Society.
Copyright ©
2025 Astronomy Image Explorer. All Rights Reserved.