Image Details
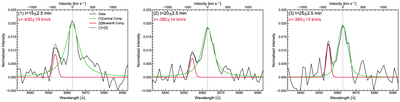
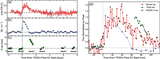
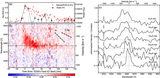
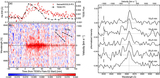
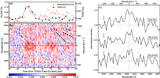
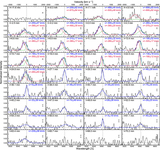
Caption: Figure 10.
Temporal evolution of pre-flare-subtracted spectra during the superflare on 2022 April 16 (E2). To improve the signal-to-noise ratio for fitting, the data have been binned into 5-minute intervals. The magenta and green lines represent the results of fitting with a two-component Gaussian, and the dashed lines correspond to the sum of the two Gaussians. Please see Figure 7 for the other spectra of flare E2 without significant blueshifted components.
Other Images in This Article

Show More
Copyright and Terms & Conditions
© 2024. The Author(s). Published by the American Astronomical Society.
Copyright ©
2025 Astronomy Image Explorer. All Rights Reserved.