Image Details
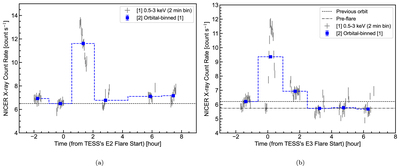
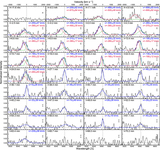
Caption: Figure 25.
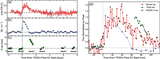
X-ray (0.5–3 keV) light curves binned for each ISS orbit around superflares on 2022 April 16 (E2) and 2022 April 17 (E3). The gray points represent the data with a time resolution of 2 minutes, while the blue points correspond to the average of the gray data for each ISS orbit (∼90-minute period). The horizontal lines denote the pre-flare values. For flare E3, the average value of the previous orbit and the pre-flare value just before the flare are plotted.
Other Images in This Article

Show More
Copyright and Terms & Conditions
© 2024. The Author(s). Published by the American Astronomical Society.
Copyright ©
2025 Astronomy Image Explorer. All Rights Reserved.