Image Details
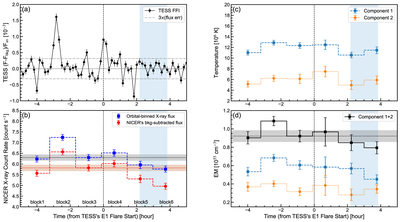
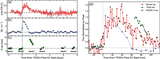
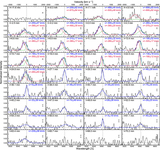
Caption: Figure 24.
Possible X-ray (0.5–3 keV) dimming after the gigantic prominence eruptions associated with the superflare on 2022 April 10 (E1). (a) Reference TESS light curve. (b) The X-ray light curve. The blue points represent the average of the gray data with a 2-minute resolution for each orbital period. The red points denote the count rate after NICER’s background subtraction. The area filled in blue represents the time interval believed to show dimming relative to the pre-flare (block 3). The area filled with gray and red represents the pre-flare level, with error bars for blue and red points data, respectively. (c), (d) The temporal evolution of the temperature and emission measure of two components. The gray-shaded area in panel (d) represents the pre-flare level with error bars.
Other Images in This Article

Show More
Copyright and Terms & Conditions
© 2024. The Author(s). Published by the American Astronomical Society.